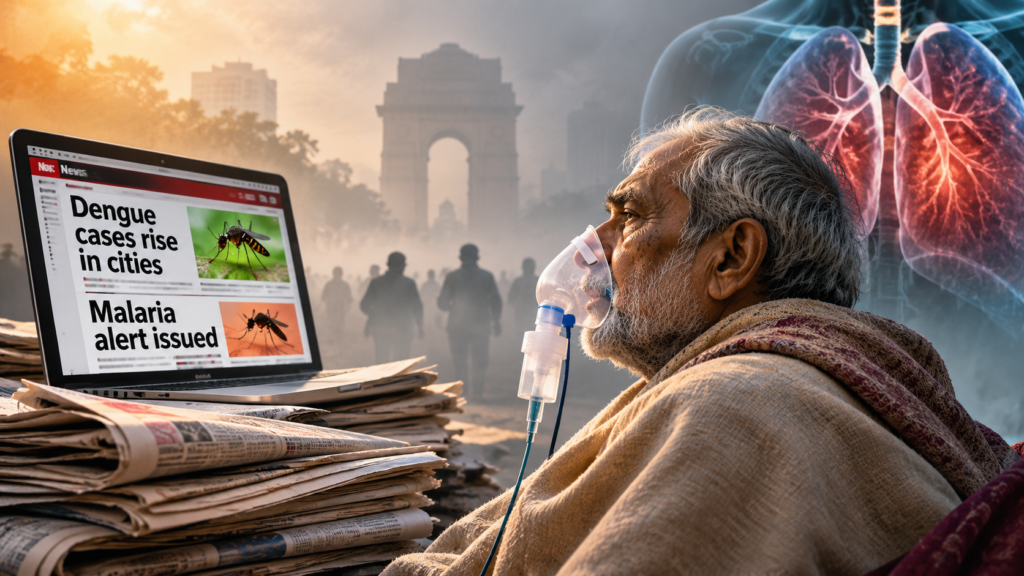
A visual representation of India's health priorities and the gap between disease burden and public attention. While chronic conditions such as COPD account for a disproportionately large share of lost healthy life, news coverage often gravitates towards seasonal outbreaks such as dengue and malaria. (Image generated by AI)
COPD (chronic obstructive pulmonary disease), a chronic lung disease, costs India a hundred times the healthy life malaria does, yet Indian news coverage of the disease is an eighth of malaria. Across news, research and funding, attention follows what is sudden, seasonal or already funded, not what is heavy.
For every year of healthy life that malaria takes from Indians, COPD takes about a hundred. In the Indian news, on our main count, malaria is named about eight times as often as COPD.
The first figure is the World Health Organization’s. In 2023, it estimates, India lost about 25.7 million years of healthy life to chronic obstructive pulmonary disease, or COPD, and about 259,000 to malaria. The second is ours, counted from Indian news published between 2019 and 2025.
This is not an oddity. We set 24 conditions, which together account for three-quarters of India’s lost healthy life, against Indian news, research, patents, company descriptions and venture funding. The same pattern appeared at every step: attention goes to what is sudden, what is seasonal and what is already funded. It does not go to what is heavy, meaning what takes the most healthy life. We measure where attention lands, not why. Below, “of every 100” always means of the 24 conditions’ combined total: of their healthy years lost, their news mentions, their research.
What is sudden
Four of the 24 dominate the news: suicide, road crashes, dengue and malaria. What they share is that they are acute, violent or outbreak-prone. Between them they take 7 of every 100 healthy years the 24 conditions cost India, and 49 of every 100 news mentions.
Compare stroke with suicide and self-harm. Stroke takes about two and a half times as much healthy life, yet the news names suicide about fourteen times as often as stroke.
The point is not that suicide deserves less attention. Suicide is thin elsewhere in our counts: research on it is a third of its share of the burden, and no venture round we found names it. Burden is also only one yardstick, and nobody would run a newsroom by it alone. But gaps of this size are not rounding errors.
At the quiet end sits COPD. It carries 6.6 of every 100 healthy years lost and gets 0.2 of every 100 news mentions, about a thirty-second of its share. Widen the search to include general phrases such as “lung disease” and that rises only to about a ninth, with malaria still named about twice as often.
Newborn conditions are also far short of their share: 9.5 of every 100 healthy years lost, and 1.1 of every 100 news mentions.
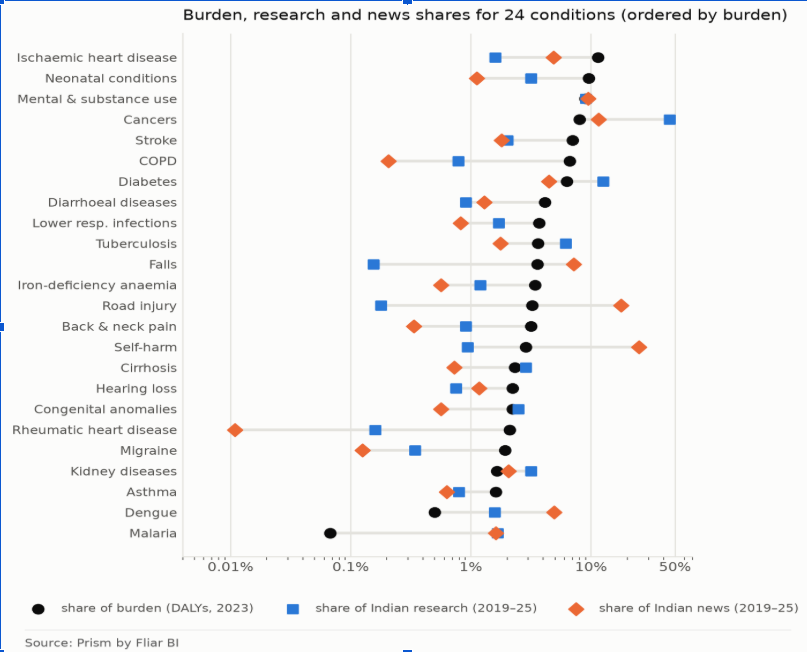
The chart shows the whole picture. Where the orange diamond sits far to the left of the black dot, as for COPD and rheumatic heart disease, a condition gets less than its share of the news; far to the right, as for suicide and road injury, more.
What is seasonal, and what is near
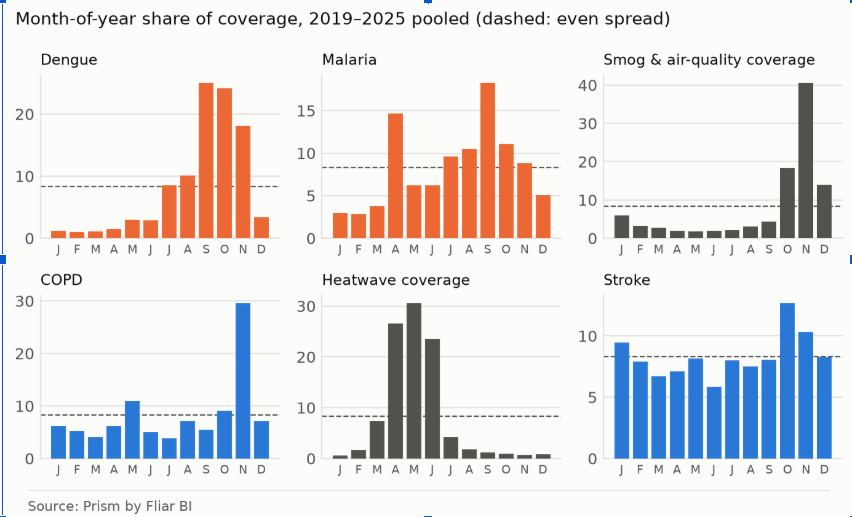
Dengue shows the calendar at work. Of every 100 dengue stories, 67 appear in September, October and November. Year to year, coverage and cases drift apart: dengue’s share of Indian news peaked in 2021, while reported cases did not peak until 2023.
News also explains dengue through the season. Software that reads Indian news and research abstracts picks out statements about what causes a disease. Of the dengue statements that fit a category, 34 in every 100 from news name weather, rain or the monsoon, against 13 from research, which more often names the virus and infection. Neither account is wrong. They are different stories.
COPD has a calendar too: nearly a third of its stories run in November, with the smog. But the November rise looks more like a habit of the calendar than a response to how loudly the smog is reported that year. Month by month, COPD and asthma stories do rise and fall with smog stories. Remove the usual yearly rhythm, though, and the link almost vanishes: a month of unusually heavy smog reporting is hardly more likely to be a month of unusually heavy lung-disease reporting. That matters because air pollution accounted for an estimated 53.7% of India’s COPD burden in 2016, more than twice tobacco’s 25.4%.
Place matters too. From 2021 to 2025, articles set in Delhi numbered 26.8 for every 1,000 dengue cases the capital reported. For Kerala the figure was 1.8, though in those years Kerala recorded 402 dengue deaths, more than any other state. A Delhi case drew about fifteen times the coverage of a Kerala one. Our news set is mostly English and Hindi, Kerala’s and Tamil Nadu’s own-language press is under-represented in it, and place labels are assigned automatically, so this describes the national conversation, not every newsroom.
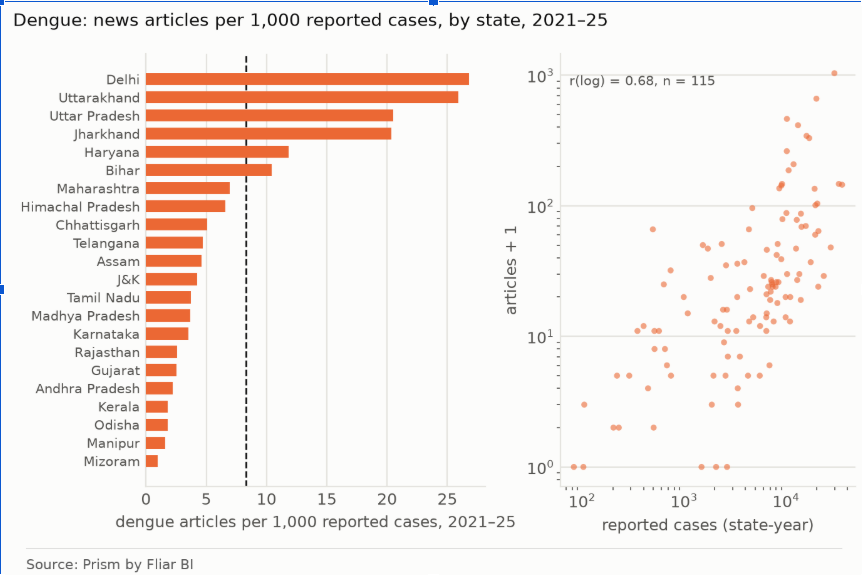
Each bar on the left is one state, with Delhi at the top and Kerala near the bottom; the dashed line is the average across the states shown, 8.3. The dots on the right drift upwards, so cases do matter, but they are scattered widely.
What is already funded
Research follows the world’s priorities more than India’s. Rank the 24 conditions by the research each receives and India’s list looks almost the same as the world’s; set against India’s own burden, the match is much looser. Cancers carry 8 of every 100 healthy years lost. They account for 45 of every 100 pieces of published Indian research on these conditions, and 55 of every 100 patented inventions that name them.
Heart disease is the opposite case. It is India’s heaviest single cause, at 11.4 of every 100 healthy years. It receives 1.6 of every 100 pieces of research, and of 243 venture rounds that name any of the 24 conditions, none names it. Round counts are floors, since only publicly reported rounds are recorded; the concentration is the firmer finding.
Put the layers together and five conditions fall short at every step: newborn conditions, COPD, stroke, rheumatic heart disease and iron-deficiency anaemia. Together they carry 29 of every 100 healthy years lost. Together they receive 3.7 of every 100 news mentions, 7.3 of research and 4.9 of venture rounds.
What could change in 2027
The data stop in 2025, so these are the habits 2027 will inherit. Each has a specific remedy.
Editors. Plan COPD coverage for the months when the smog is not the story; nearly a third of what COPD gets now lands in November. Make newborn conditions a standing beat. Assign dengue reporting by deaths and cases, not distance from the newsroom: Kerala recorded the most dengue deaths and received 1.8 articles per 1,000 cases. And once a year, count your own stories by condition and set them beside WHO’s burden table.
Funders. No venture round we found names heart disease, COPD or rheumatic heart disease, so public and philanthropic money would have to carry them. Heart disease is the place to start: Indian research on it grew 1.8 times between 2010–14 and 2021–25, against 2.6 times for Indian biomedical research as a whole.
Health departments. Publish state burden and case data in a current, machine-readable form. The state-by-state burden estimates we used date from 2016, and state dengue counts arrive as a PDF table. Reporters and researchers can compare only what is published in a form they can use.
The smog stories will return in the autumn; they crowd October to December in our data. The test for 2027 is whether COPD is written about in March as well as in November.
How we did this
We counted how often Indian news (298,667 articles, 2019–2025), research, patents, company descriptions and venture rounds name 24 conditions that make up 75% of India’s lost healthy life (disability-adjusted life years, WHO 2023). Shares are of those 24. News counts use each article’s opening lines; patent, company and funding counts are floors. A locally run language model, as second reader, judged about three in four matched news openings truly about the condition. Four conditions whose rules failed are not discussed. Cause statements are software readings, checked on small samples.
About the author
Neetika Tanwar is a researcher at Fliar BI who studies how news coverage, research and public data line up across India’s health, business and policy, with a focus on measurable gaps between public attention and real-world need.
Author’s note on AI assistance
The analysis used Fliar BI’s own data tools, including a locally run language model to check the classification rules. AI tools assisted with code and drafting. The author checked every figure against the underlying data.