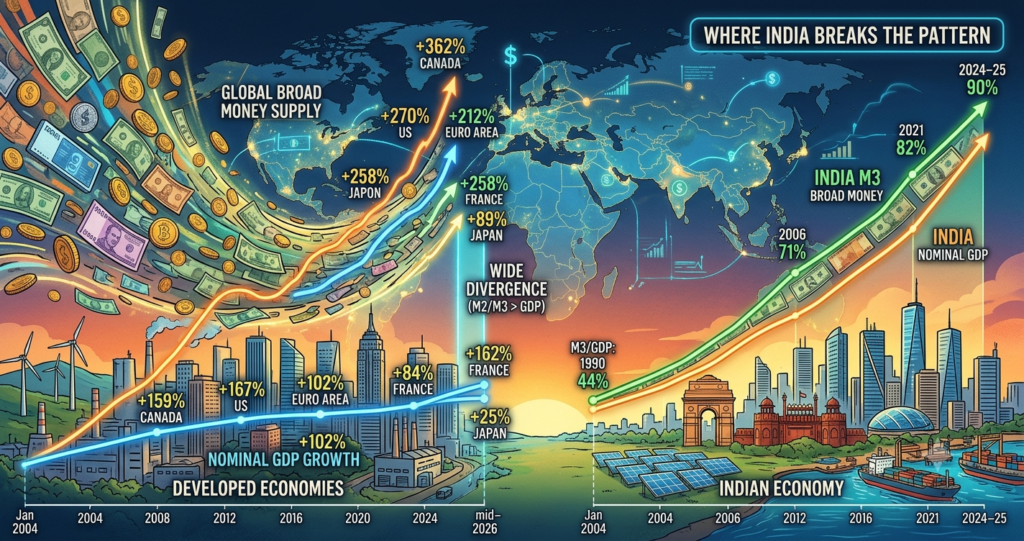
A unique thing is happening in the global economy. Economists mat still be debating whether this is signal for an impending crisis or just a restructured reality of a post-2008 post-Cobid 21st Century. The world, especially the developed bloc, is having more spendable money than its GDP should logically indicate it to have. It’s been building up for more than two decades while we are still in the third decade of this Century. India, curiosly, stands as an outlier.
Since January 2004, broad money has grown two to three times faster than nominal GDP in every major developed economy — the widest, longest divergence on record. But add India to the comparison and the story changes: money and output there have grown at nearly the same pace. What that split says about the risk of a global crisis is a genuinely contested question, not a settled one.
The developed-world numbers
Comparing cumulative M2 growth against cumulative nominal GDP growth since January 2004:
| Economy | M2 growth | Nominal GDP growth | Gap |
|---|---|---|---|
| Canada | +362% | +159%* | ~2.3x |
| United States | +270% | +167% | ~1.6x |
| Euro Area | +212% | +102%* | ~2.1x |
| France | +258%* | +84%* | ~3.1x |
| Japan | +89% | +25%* | ~3.6x |
*Figures marked with an asterisk are drawn from secondary/aggregator sources rather than cross-checked directly against a primary series and should be treated as indicative rather than exact.
Independently checked figures (Canada, US, Japan and Euro Area M2, plus US GDP) came within a few percentage points of these numbers against primary sources — the US Federal Reserve’s H.6 release, the Bank of Canada, the European Central Bank and the Bank of Japan. Small differences are normal and stem from which exact month is used as the base and periodic data revisions. The underlying pattern is real: in every one of these five economies, money has grown two to three times faster than the real economy it is supposed to represent.
Where India breaks the pattern
India doesn’t publish M2 as its primary broad-money measure — the Reserve Bank of India tracks M3 (currency, demand deposits and time deposits of over one year) as the standard gauge of broad money, and that’s the appropriate comparison here.
The headline growth numbers for India look dramatic in isolation: M3 has expanded roughly twelve fold since 2004, and nominal GDP has grown by a similar order of magnitude — India’s economy went from around $700 billion to nearly $4 trillion over the same period, partly on real growth, partly on rupee depreciation and inflation baked into “nominal” terms. Raw growth-rate comparisons across a fast-developing, rapidly financialising economy like India’s are consequently a poor guide.
The more meaningful measure is the M3-to-GDP ratio, which strips out the shared effects of inflation and currency movements and shows how fast money is growing relative to output over time:
- 1990–91: M3/GDP ≈ 44% (Indian Ministry of Finance, Economic Survey 2007–08)
- 2006–07: M3/GDP ≈ 71% (same source)
- 2021: M3/GDP ≈ 82% (World Bank, Broad Money % of GDP)
- 2024–25: M3/GDP ≈ 90% (RBI M3 data against Ministry of Statistics nominal GDP)
Over roughly two decades — the same window used for the developed-economy comparison — India’s ratio has risen by somewhere in the region of 25–40% in relative terms (from the high-60s/low-70s percent in the mid-2000s to around 90% now).
That is a meaningfully different picture from Canada’s ~2.3x gap or Japan’s ~3.6x gap. India’s money supply has grown only modestly faster than its economy, not two to three times faster.
This is best understood as financial deepening rather than monetary overhang: as more Indians gained access to bank accounts, formal savings products and digital payments (accelerated sharply by demonetisation in 2016 and UPI’s rise since), a growing share of transactions and savings moved into the formal, measured banking system.
A rising M3/GDP ratio in a still-financialising economy is a normal, broadly welcomed feature of development — the same phenomenon that took the US and Japan through their own high-growth-in-financial-depth phases in the mid-20th century, long before either had internet banking. It is not obviously comparable to a mature, fully-banked economy’s money supply suddenly outrunning its output.
What M2/M3 actually measure
Broad money is a standard measure of the money supply: cash in circulation, current and savings account deposits, and other near-cash instruments. It is not printed currency in the literal sense — most of it exists as bank deposits, created when banks extend credit.
Nominal GDP measures the current-price value of goods and services produced in a year. When money grows faster than GDP, more money is chasing a slower-growing pool of actual output — the essential imbalance behind this whole discussion.
Why the developed-world gap opened
Three overlapping policy episodes, stretched across two decades, explain most of the divergence in the US, Canada, the Euro Area, France and Japan:
- Near-zero interest rates, held for much of 2009–2015 and again through 2020–2021, which made bank lending — and therefore new deposit creation — cheap.
- Quantitative easing, after the 2008 crisis and far more aggressively in 2020, injecting liquidity directly into the financial system via central bank asset purchases.
- Historic fiscal deficits, especially the 2020–2021 pandemic stimulus, which put money straight into household and business accounts — the single largest driver of the post-2020 acceleration across all five.
India’s monetary and fiscal response to the same events (2008, 2020) was real but structurally smaller relative to the size of its already-growing money supply, and its economy’s underlying nominal growth rate — driven by high real GDP growth plus persistently higher inflation than the developed world — has simply kept closer pace.
Where does the ‘excess’ money go?
This is the genuinely contested part, and reasonable economists disagree, in developed markets at least.
The quantity theory of money would predict that when money supply outpaces output, the difference shows up as inflation. That hasn’t played out uniformly, and the standard explanation is that the velocity of money — how often each unit of currency changes hands per year — has fallen sharply since 2008 in most developed economies. If money sits in savings accounts, pension funds or asset markets rather than being spent, broad money can balloon without triggering the consumer price inflation a simpler model would predict.
Three channels, not mutually exclusive, absorb the divergence:
- Asset price inflation — flowing into housing, equities, gold rather than consumer goods.
- Currency debasement — a gradual erosion of purchasing power that doesn’t necessarily show up as a headline inflation spike.
- Consumer price inflation — the classic channel, materialising when money actually circulates.
Sceptics of the “monetary overhang” framing argue this is largely by design: central banks wanted looser financial conditions after 2008 and in 2020, asset-price transmission was an intended channel of QE, and low realised inflation through most of the 2010s suggests the system absorbed the liquidity without breaking.
The counter-view is that a persistent, multi-decade divergence of this magnitude is unprecedented, and that the risk shows up not as a sudden crisis but as slow-moving distortions — unaffordable housing, stretched asset valuations, rising household debt — already visible in several of these economies.
Two opposite developed-world case studies
Japan is the extreme test of the “money causes inflation” thesis, and the result complicates it. Decades of aggressive monetary easing (M2 +89% since 2004) have coincided with almost no nominal GDP growth (+25%) and, until very recently, near-zero inflation.
The excess liquidity did not flow into consumer prices; it sat in a stagnant economy with weak credit demand — a textbook liquidity trap.
Canada sits at the other extreme: the widest gap of the five, paired with the most aggressive household leverage and one of the most inflated housing markets in the G7. If the “asset inflation” channel is real, Canada is arguably its clearest case study.
Does this signal a global economic crisis?
Short answer: the M2/GDP gap on its own is not the risk indicator that institutions responsible for financial stability are currently pointing to — but it sits underneath several things they are worried about, and reasonable people read the connection differently.
What the data actually shows
The gap is a real, sustained, and — for the developed world — historically unusual divergence. It reflects two decades of central banks and governments substituting monetary and fiscal expansion for other forms of demand support, particularly after 2008 and in 2020. That much is not in dispute.
What it doesn’t automatically prove
A large stock of money sitting in a financial system does not, by itself, cause a crisis. Crises are typically triggered by a repricing event — a sudden loss of confidence, a credit event, a liquidity squeeze — not simply by the size of the money stock. Japan’s experience is the clearest evidence that an economy can carry a very large monetary overhang for decades without it detonating into a crisis; it detonated, if anything, into stagnation instead.
What institutions are actually flagging right now, as of mid-2026:
- The Bank for International Settlements’ Annual Economic Report 2026 names near-record public debt, fragile liquidity in core bond markets amid stretched valuations, and increasingly leveraged AI-related financing as the top pressure points — explicitly a “fiscal-financial stability nexus” risk, not a headline money-supply risk.
- The IMF’s Global Financial Stability Report (April 2026) similarly points to elevated public and private debt, growing leverage outside the banking system, and stretched risk-asset valuations, while noting markets have so far remained “orderly.”
In other words, the institutions with the clearest mandate to call a crisis are watching debt sustainability, leverage and valuation — outcomes the money-supply gap plausibly contributed to — rather than treating the M2/GDP ratio itself as the trigger. The relationship is closer to a pressure gauge than a fuse: the monetary overhang describes conditions that made today’s stretched valuations and debt-financed growth possible, without being the mechanism that would, on its own, cause them to unwind.
Where the disagreement actually lies:
- The ‘it’s fine’ case: low realised consumer inflation through most of the 2010s, orderly markets through 2025–26 despite geopolitical shocks, and Japan’s decades-long precedent all suggest developed economies can carry a large monetary overhang indefinitely, provided central banks retain credibility and can act as backstops when volatility spikes.
- The ‘it’s a slow-burn risk’ case: the overhang has already expressed itself as unaffordable housing (Canada, and much of the Anglophone world), stretched equity and credit valuations, and rising household and government debt loads — all identified by the BIS and IMF as live vulnerabilities. On this view, the money-supply gap isn’t the crisis itself, but the reason the system has less room to absorb the next shock without a sharper, more disorderly repricing than in the past.
Where India fits into this question
Precisely because India’s money supply has not dramatically outrun its economy, it is a useful counter-example rather than a second data point for concern: it suggests the developed-world pattern is a function of specific, identifiable policy choices (near-zero rates, repeated QE, historic pandemic-era deficits in already-mature, slow-growing economies) rather than an inevitable global phenomenon. A genuinely global monetary crisis would be harder to argue for if one of the world’s largest economies shows a fundamentally different monetary trajectory over the same twenty years.
The bottom line
The underlying arithmetic for the developed world isn’t in dispute: money supply has expanded significantly faster than real economic output across the US, Canada, the Euro Area, France and Japan for two consecutive decades, an imbalance without a clear modern precedent. India, by contrast, shows money and output growing at a much closer pace over the same period — a reminder that this is a story about specific monetary and fiscal choices in specific economies, not a universal law of modern money.
Whether the developed-world gap amounts to a slow-building global crisis or a manageable, if unusual, side-effect of two decades of crisis-response policy is where genuine expert disagreement lies — and it is a question about what happens next, not about what the numbers already show.