News Analysis | thefreepen.in | 13 March 2026
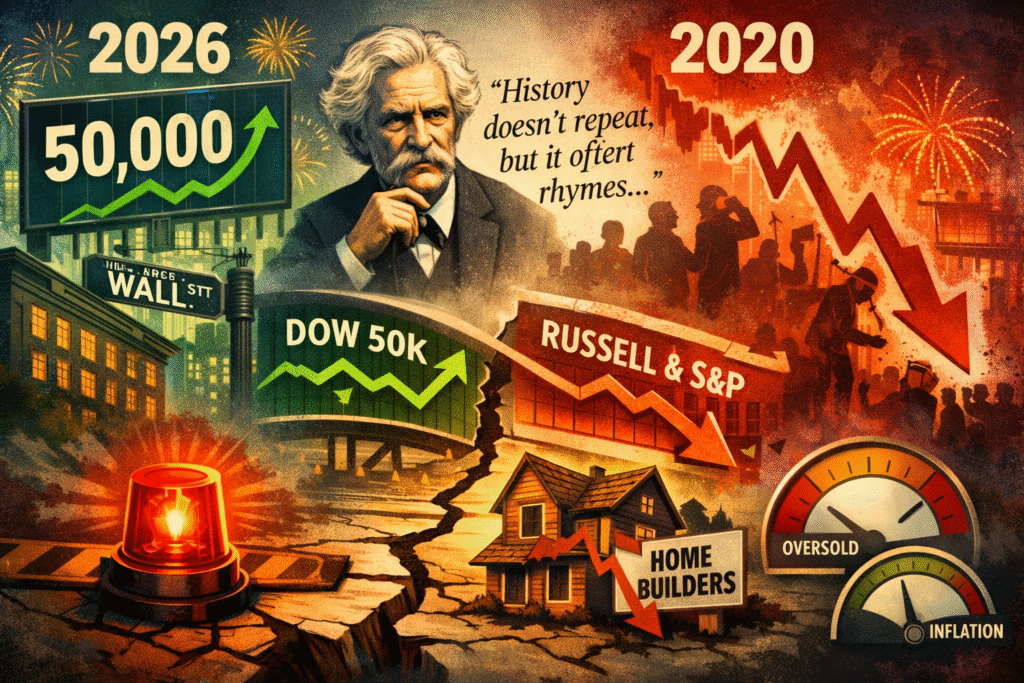
There is a phrase that serious investors keep returning to in moments of market stress, attributed — perhaps apocryphally — to Mark Twain: history doesn’t repeat itself, but it often rhymes. Six years after the most terrifying single-month market collapse of the modern era, a growing number of market watchers are noting, quietly at first and now with some urgency, that the rhyme is getting uncomfortably close.
The month of March 2026 has arrived carrying the same uneasy atmosphere as its 2020 counterpart. Equities have been grinding lower. Sentiment has soured. And beneath the surface of the headline numbers, the structure of the market is sending signals that technical analysts have long associated with major turning points — rarely benign ones.
The non-confirmation that nobody wants to talk about
Cast your mind back to early 2020. The Dow Jones Industrial Average had reached a record high. Optimism was in the air. And then, quietly, other key indices began to diverge. The broader market — smaller companies, cyclical sectors, the real economy — did not confirm what the Dow was celebrating. Within weeks, the divergence became a rout.
Something strikingly similar has just occurred. Approximately one month ago, the Dow Jones crossed the psychologically significant 50,000 mark, a milestone that was duly celebrated by policymakers in Washington. But the Russell 2000 — the index of smaller American companies that often serves as the economy’s true pulse — refused to follow. Neither did the S&P 500 in any convincing fashion. In the language of technical analysis, this is called a non-confirmation, and it is, as any market textbook will tell you, one of the classic hallmarks of a major market top.
When the headline index celebrates while the broader market quietly declines, history has repeatedly shown that the celebration tends to be short-lived.
Non-confirmations do not guarantee a crash. They are warning lights, not sentences. But when they appear alongside other deteriorating signals — and right now, several are flashing simultaneously — they deserve to be taken seriously.
The oscillator at the edge
One of the most watched technical gauges of market health is the NYSE McClellan Advance-Decline Oscillator, a measure of internal market breadth — essentially, how many stocks are genuinely participating in moves up or down. As of this week, that oscillator has reached the same extreme oversold reading it hit on 9th April 2025, the day markets reached their low point following the tariff panic.
That comparison cuts both ways. On the one hand, extreme oversold readings of this nature resolve in a sharp market bounce roughly 90 per cent of the time — equities simply cannot sustain selling pressure indefinitely without attracting buyers. A relief rally in the near term would surprise no one.
On the other hand, the remaining 10 per cent of cases is where the February 2018 volatility spike and the March 2020 waterfall decline live. In those instances, oversold conditions did not produce a bounce — they produced capitulation. The distinction between the two outcomes is rarely obvious until after the fact, which is precisely what makes the current reading so consequential.
The homebuilders have left the building
If one were forced to identify the single most alarming data point in current market conditions, a strong case could be made for the behaviour of the XHB Homebuilders ETF. In February, the fund posted a new 52-week high. Since then, it has fallen approximately 20 per cent — a decline of that magnitude in that timeframe is described in market parlance as moving from overbought to oversold in near-record time.
This matters beyond the housing sector itself. The American housing market sits at the intersection of consumer confidence, credit conditions, employment, and monetary policy. When homebuilders fall sharply, it tends to signal that the credit-sensitive, rate-sensitive, and employment-sensitive parts of the economy are under genuine stress — not the kind that resolves itself in a quarter or two.
An unusual signal hidden in the inflation data
Buried in the inflation figures is a relationship that rarely receives mainstream attention but is currently sending an important message. Normally, the Consumer Price Index runs about 30 to 50 basis points above the Personal Consumption Expenditures index — a modest, consistent gap that reflects the different methodologies each uses to measure price changes.
That relationship has now inverted. CPI has fallen below PCE. This is structurally significant for two reasons. First, CPI places considerably more weight on housing costs — particularly owners’ equivalent rent — than PCE does. When housing inflation decelerates sharply, CPI drops faster. Second, and more tellingly, PCE adjusts for consumer substitution: when households trade down from preferred goods to cheaper alternatives, PCE captures that shift in a way CPI does not.
In plain terms: the inversion suggests that American consumers are not merely being cautious — they are being squeezed. The housing market is cooling, and households are increasingly unable to maintain their previous spending patterns. These are not the conditions one associates with a healthy economy approaching the top of a business cycle.
A rhyme worth heeding
None of this is to say that a repeat of March 2020 is imminent, inevitable, or even the most likely outcome. Markets have a habit of confounding their most confident observers in both directions. A sharp rally could materialise as early as this week, and the oversold readings do genuinely support that possibility in the short term.
But the structure of this market — the non-confirmations, the defensive rotations, the deteriorating breadth, the consumer stress signals, and the geopolitical uncertainty surrounding the Iran conflict — resembles March 2020 enough to warrant genuine caution. Not panic, but caution. Not sweeping portfolio decisions, but a willingness to hold more cash than usual and to be far more selective about which risks are worth taking.
Markets rarely repeat. But when they rhyme this closely, it is worth listening carefully to the verse.
The most dangerous market environments are rarely the ones that feel dangerous from the outset. They are the ones that feel manageable — right up until the moment they are not.